Datapane is a Python reporting library. By using datapane with the combination of pandas dataframe, you can build very attractive reports and charts. Datapane was first released on Nov 12, 2019. Using Datapane you can build interactive reports for your end-users in less time.
Few other reporting libraries in python to generate reports in the different use cases.
- Datapane basic information.
- How to install Datapane?
- Example: Datapane tabular report example.
- Example: Datapane to generate an interactive and beautiful line chart.
1. Datapane basic information
| About | Datapane is a Python library. It was first released on Nov 12, 2019. Using Datapane you can build interactive reports for your end-users in less time. |
| install | pip install datapane |
| import | import datapane as dp |
| Url | https://docs.datapane.com/ |
| PyPI Releases | https://pypi.org/project/datapane/ |
| Is Open Source | YES, not open-contribution |
| Source Code | https://github.com/datapane/datapane |
| Latest Version | Version 0.14.0 |
Jump to the top of the page↵
2. How to install Datapane?
First, ensure pip is installed on the system, if pip is not installed then there are 2 ways to get it installed on the system
Once pip is set up on the system than by using pip install the Datapane library.
pip3 install -U datapane
Installing Datapane by using Conda: Use below command to install the datapane using conda
conda install -c conda-forge “datapane>=0.14.0”
Jump to the top of the page↵
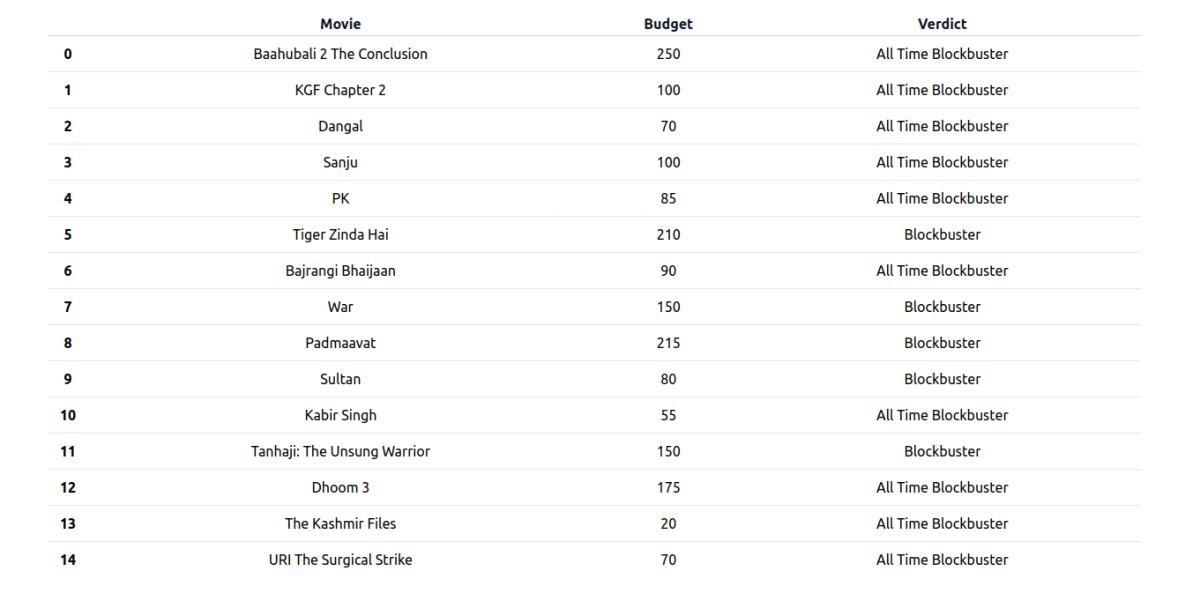
3. Example : Datapane tabular report example.
#!/usr/bin/env python3
# -*- coding: utf-8 -*-
"""
Created on Wed Feb 07:49:49 2022
website : http://mycloudplace.com
@author: Prem Shanker Verma
"""
import pandas as pd
import altair as alt
import datapane as dp
if __name__ == "__main__":
    Movies = [
        {'Movie':'Baahubali 2 The Conclusion', 'Budget':'250', 'Verdict':'All Time Blockbuster'},
        {'Movie':'KGF Chapter 2', 'Budget':'100', 'Verdict':'All Time Blockbuster'},
        {'Movie':'Dangal', 'Budget':'70', 'Verdict':'All Time Blockbuster'},
        {'Movie':'Sanju', 'Budget':'100', 'Verdict':'All Time Blockbuster'},
        {'Movie':'PK', 'Budget':'85', 'Verdict':'All Time Blockbuster'},
        {'Movie':'Tiger Zinda Hai', 'Budget':'210 ', 'Verdict':' Blockbuster'},
        {'Movie':'Bajrangi Bhaijaan', 'Budget':' 90 ', 'Verdict':'All Time Blockbuster'},
        {'Movie':'War', 'Budget':'150', 'Verdict':'Blockbuster'},
        {'Movie':'Padmaavat ', 'Budget':'215', 'Verdict':' Blockbuster'},
        {'Movie':'Sultan', 'Budget':'80', 'Verdict':' Blockbuster'},
        {'Movie':'Kabir Singh', 'Budget':'55', 'Verdict':' All Time Blockbuster'},
        {'Movie':'Tanhaji: The Unsung Warrior', 'Budget':'150', 'Verdict':' Blockbuster'},
        {'Movie':'Dhoom 3', 'Budget':' 175 ', 'Verdict':'All Time Blockbuster '},
        {'Movie':'The Kashmir Files', 'Budget':' 20', 'Verdict':'All Time Blockbuster'},
        {'Movie':'URI The Surgical Strike', 'Budget':'70 ', 'Verdict':'All Time Blockbuster'}
        ]

    df = pd.DataFrame(Movies)

    report = dp.Report(dp.Table(df))
    report.save(path="MoviesTabular.html")
OUTPUT:
Jump to the top of the page↵
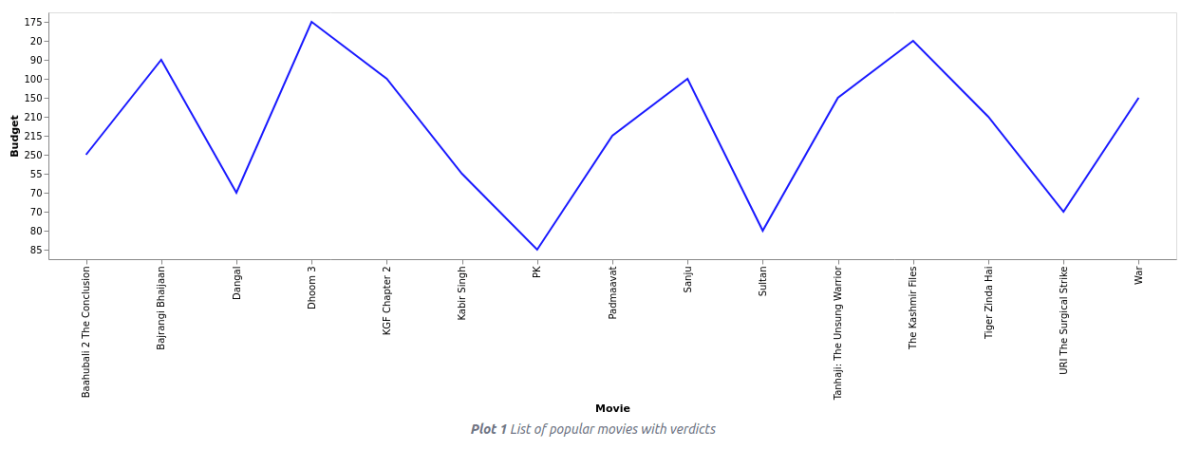
4. Example: Datapane to generate an interactive and beautiful line chart.
#!/usr/bin/env python3
# -*- coding: utf-8 -*-
"""
Created on Wed Feb 07:49:49 2022
website : http://mycloudplace.com
@author: Prem Shanker Verma
"""

import pandas as pd
import altair as alt
import datapane as dp

if __name__ == "__main__":
    Movies = [
        {'Movie':'Baahubali 2 The Conclusion', 'Budget':'250', 'Verdict':'All Time Blockbuster'},
        {'Movie':'KGF Chapter 2', 'Budget':'100', 'Verdict':'All Time Blockbuster'},
        {'Movie':'Dangal', 'Budget':'70', 'Verdict':'All Time Blockbuster'},
        {'Movie':'Sanju', 'Budget':'100', 'Verdict':'All Time Blockbuster'},
        {'Movie':'PK', 'Budget':'85', 'Verdict':'All Time Blockbuster'},
        {'Movie':'Tiger Zinda Hai', 'Budget':'210 ', 'Verdict':' Blockbuster'},
        {'Movie':'Bajrangi Bhaijaan', 'Budget':' 90 ', 'Verdict':'All Time Blockbuster'},
        {'Movie':'War', 'Budget':'150', 'Verdict':'Blockbuster'},
        {'Movie':'Padmaavat ', 'Budget':'215', 'Verdict':' Blockbuster'},
        {'Movie':'Sultan', 'Budget':'80', 'Verdict':' Blockbuster'},
        {'Movie':'Kabir Singh', 'Budget':'55', 'Verdict':' All Time Blockbuster'},
        {'Movie':'Tanhaji: The Unsung Warrior', 'Budget':'150', 'Verdict':' Blockbuster'},
        {'Movie':'Dhoom 3', 'Budget':' 175 ', 'Verdict':'All Time Blockbuster '},
        {'Movie':'The Kashmir Files', 'Budget':' 20', 'Verdict':'All Time Blockbuster'},
        {'Movie':'URI The Surgical Strike', 'Budget':'70 ', 'Verdict':'All Time Blockbuster'}
        ]

    df = pd.DataFrame(Movies)

    plot = (
    alt.Chart(df).mark_line(color='blue',opacity=0.9)
    .encode(
        x="Movie",
        y=alt.Y("Budget"),

    )
    .interactive()
    )

    report = dp.Report(
    dp.Plot(plot, caption="List of popular movies with verdicts")
    )

    report.save("MoviesChart.html")
OUTPUT:
Jump to the top of the page↵
Below are my previous articles
- Jinja a template based python library for beautiful and interactive reports
- Python reporting libraries | Python reporting tools to generate interactive and beautiful reports
- pyspark dataframe | python spark dataframe with examples
- A to Z of Python exception handling | Python try catch with example
- File Handling Python With Examples | Python Input-Output Awesome Tips
- Modules in python tactics that can boost your python programming skills
- Python array | numpy for python | How to create numpy or np array in python
- Python Lambda Function With Examples | How To Create A New Anonymous function
- Python Useful Built-in Functions With Examples | How to create a new function
- python iteration | while loop | for loop with examples
- Python Data Types With Examples
- Python – installation indentation variable comments
- Python Programming Introduction
Pingback: Python reporting libraries | Python reporting tools to generate interactive and beautiful reports - Mycloudplace
useful site
Artificial intelligence using python to create content for the site, no worse than a copywriter, you can also use it to write articles. 100% uniqueness :).
Thank you.
Good.
Thank you.
you made some decent points there. I looked on the internet to learn more
about the issue and found most individuals will go along with your views on this web site.
Wonderful post! We are linking to this particularly great post
on our site. Keep up the good writing.
Excellent post on datapane. Keep writing such kind of information on your blog.
I am really impressed by your blog.
Thank you for the information, datapane is really a strong python library for reporting.
Pingback: Python obfuscation | Great technique to hide python code | Perfect use of pyarmor - Mycloudplace